Continuing on with the story about the land mass distortions, my friend and I Ire also talking about how many of the immigrants in Australia came from different nations across the world and how different things are for them now. In general, the demographics from the different countries are varied, completely different from Australia, and I thought it would be interesting to do a comparative study. This is not a comprehensive study – merely something of interest for us. Perhaps one day I will increase the scope. For this study I included the islands of Tasmania, Sri Lanka, Madagascar, Iceland, New Zealand, Fiji, New Caledonia, Vanuatu and Greenland. These were selected because they are of particular interest to me. I initially also included Papua New Guinea but removed it because of various issues with the available data and its interpretation.
The story is best told by a few graphs. I will let those speak for themselves (for the most part), but first a word about the data. The data in this study comes from Wikipedia for the most part but, I did compare it with data from individual countries and the numbers are all in the right ballpark – good enough for my purpose here.
This first graph just shows the land masses. From the previous blog we know that Madagascar is about a fourth the size of Greenland, so what’s up with the graph? I wanted to have a realistic comparison, so I considered the fact that Greenland’s interior is really uninhabitable. So I tweaked all the data to removed the areas which are uninhabitable. For Greenland these are areas that are (currently) covered with ice, leaving a smaller but still sizable area. The rest of this story is told by the graph itself.

The next graphic does not require much explanation – these are pure population numbers. But do take note of how these countries compare to one another – and also pay attention to the differences with this and the previous graphic. Notice how Sri Lanka has moved from 6th place to second.

My next graphic is the really interesting one – and to be honest, the reason I removed uninhabitable areas. But, even after I did that, Greenland’s population density is still too small to be meaningful within this study. So, whereas Sri Lanka is the fifth largest island nation in this study and their population is the second largest, the population density is significantly larger. They are followed by Fiji with Madagascar coming in third. Greenland’s population density is so low that it does not even register on the graph.

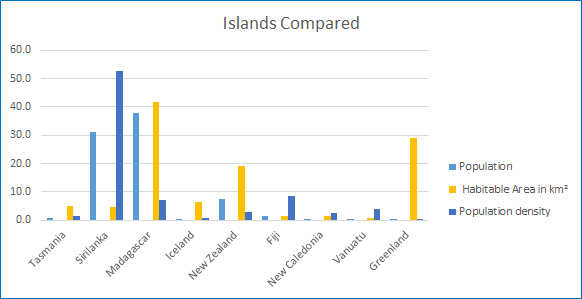
I also wanted to represent these three datasets in one graph, just to get a normative perspective of what is really going on. And this is it. I normalised all the data to a weighted average in order to display them together on this bar chart. It puts a lot of this discussion in a nice perspective. The graph tells the rest of the story.